Latest News › Forums › Discussion Forum › SARS cov2 and Covid 19 › Reply To: SARS cov2 and Covid 19
– “now slightly more in Russia”
It’ll keep going up.
Timing is the most important matter to get our heads around; many of the mistakes are because people look at a static snapshot, but covid-19 doesn’t stand still. The infection rate increases if it can, when social restrictions are light enough, but we never know how many are infected, because 80% of the infected have no symptoms, and 100% of the infected are infectious before symptoms show.
The best estimate we get comes two weeks later, as the deaths show up. Then we can estimate how many must have been infected two weeks previously. That’s how the (unfairly maligned) ICL model works.
In Russia, a higher proportion of cases are getting detected because Russia does more tests per head of population. Russia is also a big place, so there is less travel between far-flung cities, less dispersion of infection, relatively speaking, so the authorities have more idea where to target tests.
Comparing how well or badly countries are doing is best revealed by plotting on one graph deaths against time for each country. That gives a load of curves rising at different rates. But the crucial step is to shuffle each country’s line horizontally, to align all their starting points to a fixed number of deaths, to remove the differences created by the pandemic arriving at different times in different countries.
Here is one such graph, for comparing countries mandating face masks against countries that don’t. The graph is from about 40% down in this systematic review. Unfortunately the starting points were aligned by cases rather than deaths, and the comparison is thus subject to distortion by how much testing was done and how testing was targeted – ironically, better testing makes the country’s problem look worse. The graph also doesn’t include Russia, but it does show you the type of graph you need to find.
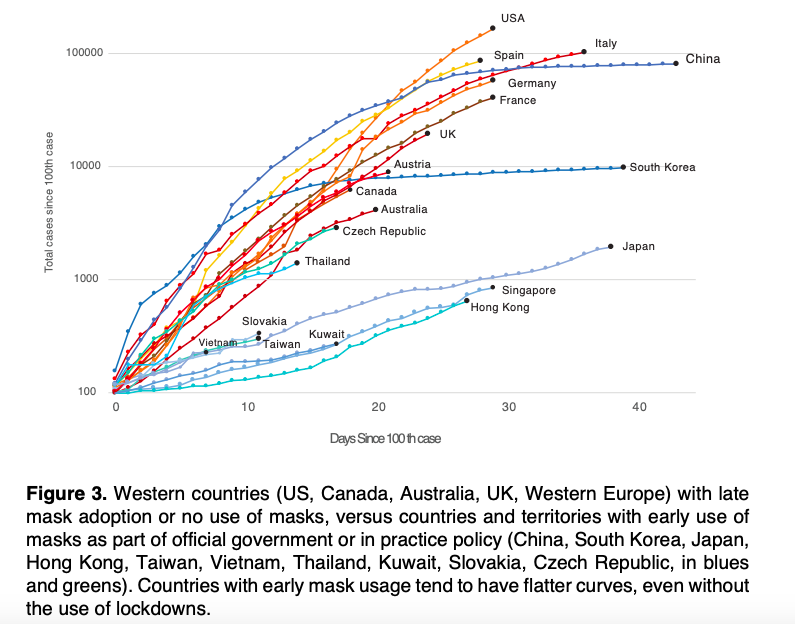
Note that the vertical axis in that graph is logarithmic; each higher horizontal division is a factor of ten greater. The straightest lines would be curving upwards if the “number of cases” axis was linear; such “log-linear” graphs turn exponential growth into a straight slope. Note lines that curve towards the horizontal; that indicates the effect of social restrictions.